Where do I find the Thread network map in Home Assistant?
The visualizer lives inside the Matter Server add-on's own interface, not the main Home Assistant dashboard. Open the add-on (Settings → Add-ons → Matter Server, or the equivalent panel if you're running the standalone matter.js server), and look for a dashboard with three tabs: Nodes, Thread, and Wi-Fi. The Thread tab is the one that matters here — it renders your mesh as a node diagram rather than a list.
This is a byproduct of matter.js exposing the Thread Network Diagnostics Cluster, a standard part of the Matter/Thread spec that every Thread device reports over: its role in the network, and a neighbour table listing which other devices it can talk to directly. The visualizer takes that raw diagnostic data and turns it into a picture.
How do I read the Thread network diagram?
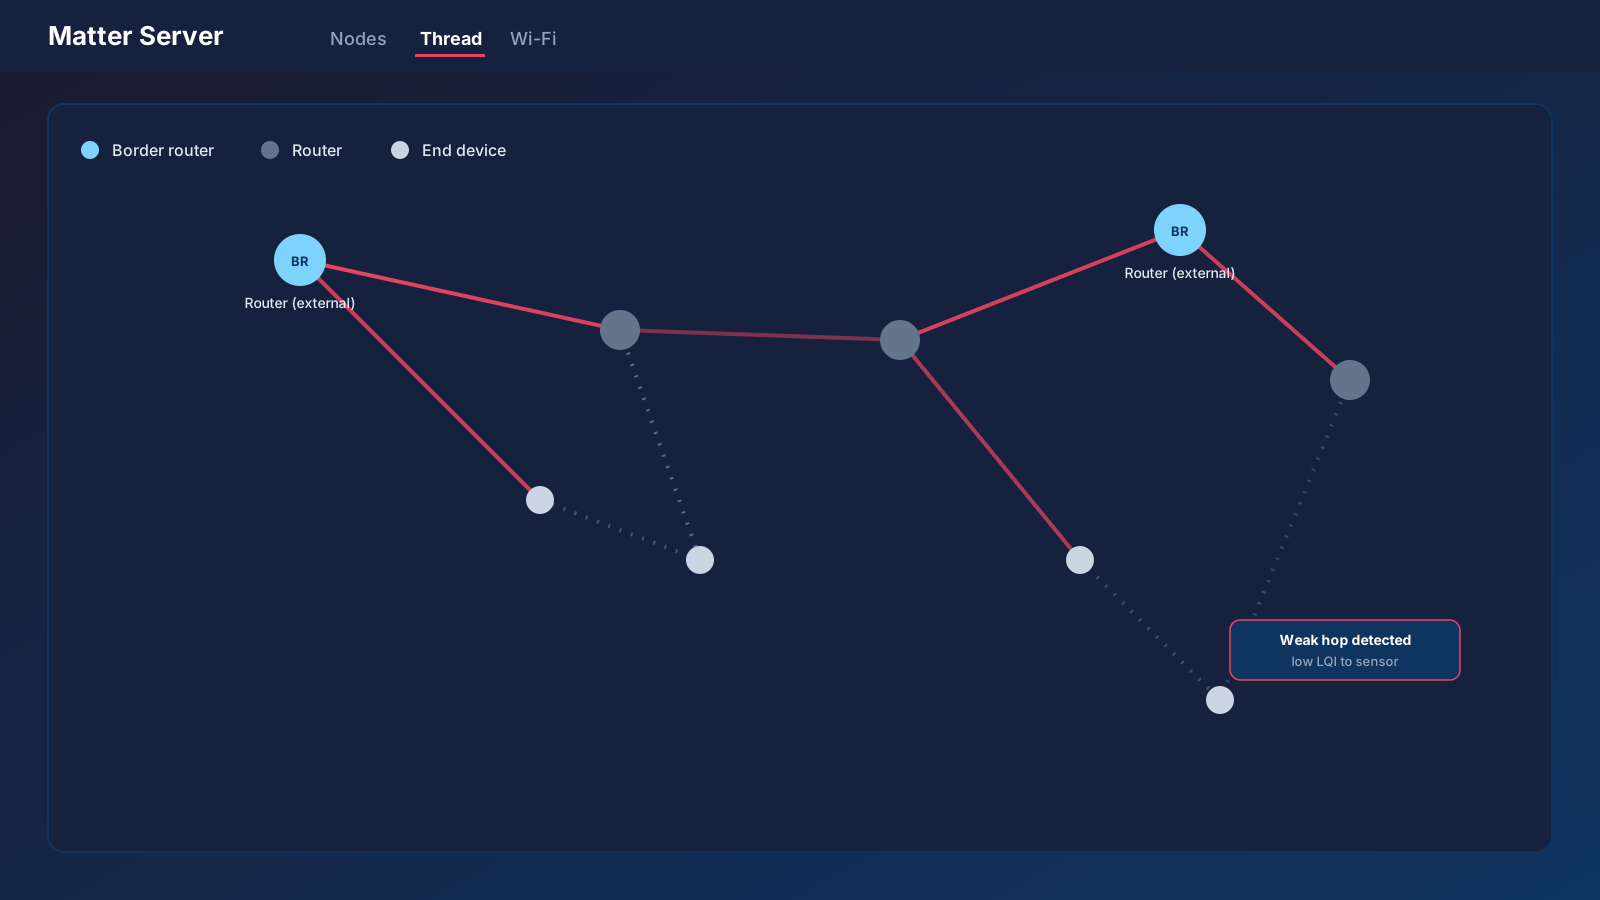
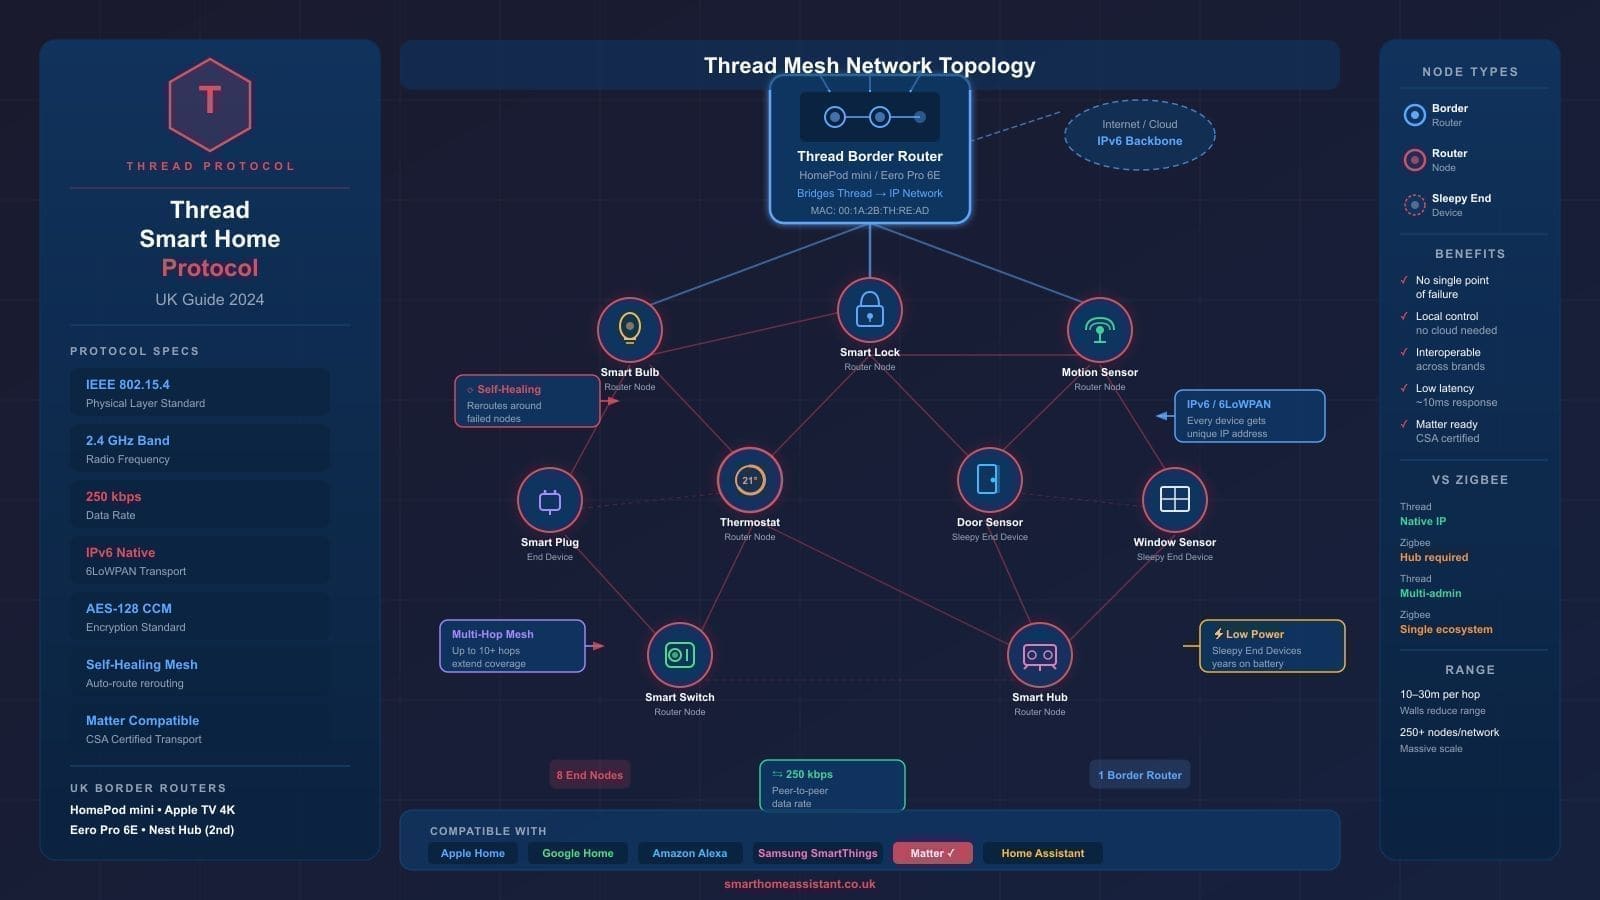
Each node is colour-coded by its role in the mesh. Border routers — the devices that bridge your Thread network to your regular Wi-Fi/Ethernet LAN, usually a HomePod mini, Apple TV, Nest Hub, or a dedicated Thread border router like an Eero or Aqara hub — show up in light blue. Routers, which relay traffic for other devices but don't bridge to the LAN, appear in dark grey. End devices, the battery-powered sensors and simple accessories that only talk to their nearest router, show up in light grey.
The lines connecting nodes are colour-coded too, based on Link Quality Indicator (LQI) values pulled from each device's routing table — so a weak, congested hop between two devices looks visibly different from a strong one. That's the actual diagnostic value here: instead of guessing why a battery sensor keeps dropping out, you can trace its connection back through the mesh and see exactly which hop is weak.
One current limitation worth knowing before you go looking for it: Thread border routers don't yet have a native Matter device type of their own, so most show up labelled "Router (external)" rather than explicitly as border routers. You can usually still tell which is which from context — a HomePod mini or Apple TV labelled "Router (external)" is functioning as a border router even if the label doesn't say so outright.
For Thread networks with several hops between a device and the nearest border router, the diagram also discovers and draws in border routers that aren't directly connected to the device you're inspecting, so you can see the full path rather than just the immediate neighbours. That matters in larger homes where a sensor at one end of the house might route through two or three intermediate devices before reaching a border router near the internet connection.
Why is the Thread network map a bigger deal than it sounds?
Before this, diagnosing a Thread mesh meant reading raw diagnostic data by hand or reaching for a community tool. A member of the Home Assistant community forum had already built and shared a lightweight third-party Thread visualizer, precisely because nothing built-in existed — and a long-running feature request thread asking Home Assistant for exactly this kind of diagnostic map had sat open for years without an official answer. Thread, unlike Zigbee, doesn't have a long history of dedicated Home Assistant tooling built around it, so most users troubleshooting a dropped Thread device were reduced to guesswork: power-cycle it, move it, hope.
The underlying data was always there — every Thread device reports its neighbour table and role over the Thread Network Diagnostics Cluster, which is part of the Matter/Thread specification rather than something Home Assistant invented. What changed in 2026.7 is that Home Assistant's own Matter server now reads that cluster and renders it, so you no longer need a third-party add-on or manual API calls to see it.
How do I use the diagram to fix a flaky Thread device?
The practical use case is diagnosing dropouts. If a Thread sensor keeps going unavailable, open the Thread tab and find that device in the diagram. Follow its connection back toward a border router — if it's several hops deep through routers with weak-looking links, that's a strong hint the device is simply too far from a border router, and the fix is adding another Thread border router (a second HomePod mini, Apple TV, or standalone Thread hub) closer to it rather than troubleshooting the device itself.
If you're building out a Thread network for the first time rather than diagnosing an existing one, our Thread protocol guide covers what border routers actually do and which devices in the UK market can act as one. And if you haven't set up Matter in Home Assistant at all yet, start with our Matter setup guide — the Thread visualizer only appears once the matter.js server is running.
A second, more mundane use for the diagram is planning where to add hardware. If several end devices in one part of the house all route through the same single router with a weak-looking link back to a border router, that router is a single point of failure worth addressing before it fails — either by adding a second border router nearby, or by adding a mains-powered Thread device (many Thread-capable smart plugs and bulbs act as routers automatically) to give the mesh an extra path. Thread meshes get more reliable as more mains-powered devices join them, and the diagram is the easiest way to see where that's actually needed rather than guessing.
Why does this matter beyond Thread?
This lands as part of a broader shift in how Home Assistant surfaces Matter diagnostics generally. The same matter.js server update that brought the Thread tab also added a Wi-Fi tab for Matter-over-Wi-Fi devices, and cleaned up node diagnostics that were previously only visible by digging through raw JSON exports. Combined with the ZHA device page overhaul in the same release — full-page views instead of cramped pop-ups — 2026.7 is the release where Home Assistant's low-level mesh network diagnostics, across both Zigbee and Thread, stopped being something you needed a community add-on to see properly.
The mesh you'd be diagnosing here is also growing: LIFX has opened a beta letting owners of its Matter-enabled bulbs migrate them from Wi-Fi onto Thread, and each newly recommissioned bulb will show up as a fresh node on this diagram once it joins the mesh.
It's still an early tool. The "Router (external)" labelling for border routers is a known gap, and the diagram doesn't yet let you click through to a device's full Matter attribute list the way the Nodes tab does. But for the first time, diagnosing a shaky Thread mesh doesn't require a third-party visualizer or reading raw cluster data — it's built in.