InfluxDB add-on removed from the repository: what to do
If Home Assistant shows "App InfluxDB has been removed from the repository", the add-on you installed has been retired — your Home Assistant isn't broken. The notice is a repair issue: the original InfluxDB add-on was a community package built on InfluxDB 1.x, and its repository was archived, so the store no longer carries it. It will not update again.
- Don't click Submit in a hurry. Users on the Home Assistant Community thread report that submitting the repair removes the app. Dismiss it instead, and take a backup first if you want to keep your history.
- Your old data isn't migrated automatically. The archived add-on provided InfluxDB 1.x; InfluxDB 2 has a different API and data model, so you can't just point the same setup at a new version.
- The fix is to move to InfluxDB 2. On Home Assistant OS or Supervised, use the community InfluxDB v2 app; on Container or Core, run the official
influxdb:2Docker image. Both routes are in Step 1, and Step 2 reconnects the integration.
Home Assistant's built-in History and Logbook pages are useful for a quick check, but the default recorder only keeps a rolling window of data — typically 10 days — before older records are purged to keep the database small. If you want to see how your living room temperature trended over the last six months, compare this winter's heating usage to last winter's, or build a dashboard that actually looks like something out of a data centre, you need a proper time-series database and a dedicated visualisation tool.
This guide covers the current path end to end: getting InfluxDB 2 running on either install route, configuring the InfluxDB integration the way today's Home Assistant expects, connecting Grafana as a data source, and building your first panel.
What Do InfluxDB and Grafana Actually Do?
InfluxDB is a time-series database. Unlike Home Assistant's default SQLite recorder, it is built specifically to store huge volumes of timestamped numeric data — exactly what sensor readings are — and query it efficiently over long ranges. It does not replace Home Assistant's recorder; it runs alongside it. Home Assistant keeps its short-term recorder for the History and Logbook UI, while the InfluxDB integration streams a copy of your state changes into InfluxDB for permanent storage.
Grafana is a visualisation and dashboarding tool. It connects to InfluxDB (and dozens of other data sources) and lets you build custom graphs, gauges, tables, and alert rules from the stored data. It is not a Home Assistant product — it is a general-purpose open-source tool used widely in server monitoring and IoT — but it integrates cleanly with Home Assistant's InfluxDB export.
What You Need
- A running Home Assistant OS or Supervised installation for the app route, or any Home Assistant Container/Core install for the Docker route covered below.
- Basic familiarity with editing YAML, either through the File editor app or via Studio Code Server.
- Access to your
configuration.yamlandsecrets.yamlfiles.
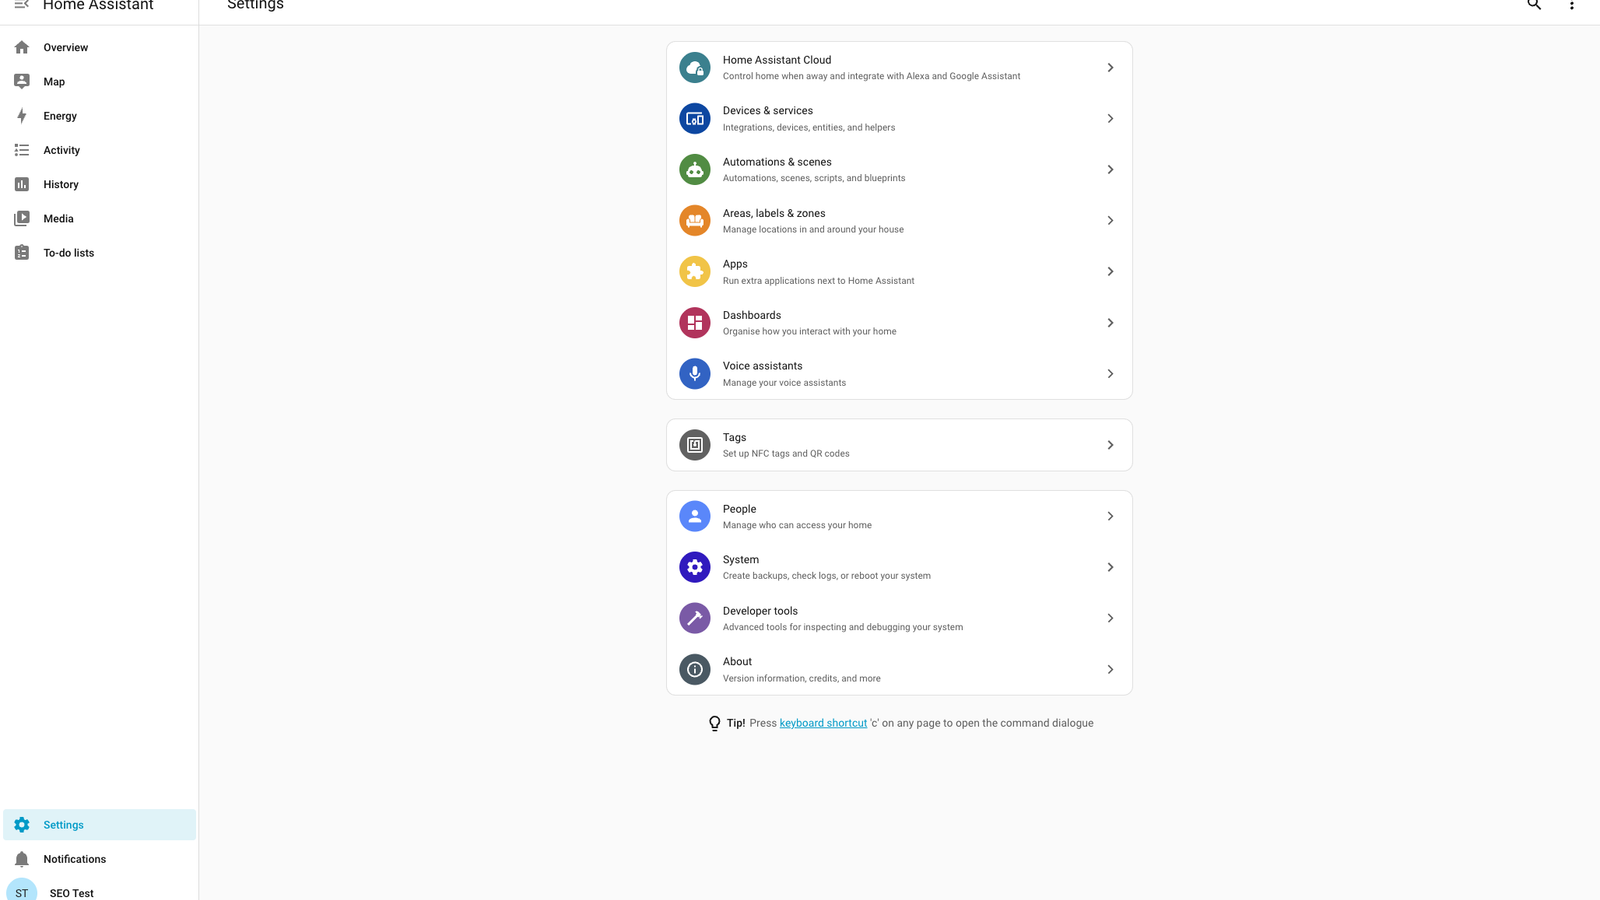
One naming note before we start, because it causes real confusion: Home Assistant now calls add-ons apps in the UI, and Settings → Add-ons is now Settings → Apps. The old name still appears in repository names, in older documentation, and in the community forum, so you will see both. Where this guide gives a click path it uses the current wording.
Step 1: Get InfluxDB Running (the Original InfluxDB Add-on Is Gone)
The original InfluxDB add-on from Home Assistant Community Add-ons has been removed from the store. InfluxDB 1.x reached end-of-life, the maintainers archived the repository in August 2026, and if you already had it installed you'll see a repair notification reading "App InfluxDB has been removed from the repository." This isn't a bug in your setup — it's an intentional retirement, and there's no automatic migration path.
You have two working options, depending on how you run Home Assistant:
| Option A — community app | Option B — Docker container | |
|---|---|---|
| Works on | Home Assistant OS / Supervised | Container / Core (or anywhere Docker runs) |
| Install | Add a third-party repository, then install | docker compose up -d |
| SSL | Not supported | Yours to configure |
| Sidebar / ingress | Not supported — open it on its port | Open it on its port |
| Main risk | Depends on one maintainer's repository | You own the upgrades |
Option A — Home Assistant OS or Supervised: install the community InfluxDB v2 app. The original repository is retired, but an unofficial package for InfluxDB 2 is available. Go to Settings → Apps, open the store, and add https://github.com/danieloldberg/addon-influxdbv2 as a repository from the store's overflow (three-dot) menu, then install InfluxDB v2 from the new repository entry. It ships a graphical admin UI and a Data Explorer for browsing your buckets, but as of writing it has no SSL support and doesn't work through Home Assistant's ingress proxy (InfluxDB 2's path-based routing isn't compatible with it) — open it directly on its port instead. Note the organisation, bucket, and admin token you set during its first-run setup.
Option B — Home Assistant Container or Core: run InfluxDB 2 as its own Docker container, alongside Home Assistant, using the official influxdb:2 image. This is what we used to verify the steps in this guide, and it's arguably the more future-proof option since it isn't tied to any third-party repository staying maintained. All three services need to sit on the same Docker network so they can reach each other by name, which a single Compose project gives you for free. Here is a complete, working docker-compose.yml:
services:
  homeassistant:
    image: homeassistant/home-assistant:stable
    volumes:
      - ./ha-config:/config
    ports:
      - "8123:8123"
    restart: unless-stopped

  influxdb:
    image: influxdb:2
    ports:
      - "8086:8086"
    environment:
      - DOCKER_INFLUXDB_INIT_MODE=setup
      - DOCKER_INFLUXDB_INIT_USERNAME=admin
      - DOCKER_INFLUXDB_INIT_PASSWORD=change-me
      - DOCKER_INFLUXDB_INIT_ORG=home
      - DOCKER_INFLUXDB_INIT_BUCKET=home_assistant
      - DOCKER_INFLUXDB_INIT_ADMIN_TOKEN=change-me-too
    volumes:
      - influxdb-data:/var/lib/influxdb2
    restart: unless-stopped

  grafana:
    image: grafana/grafana:latest
    ports:
      - "3000:3000"
    volumes:
      - grafana-data:/var/lib/grafana
    restart: unless-stopped

volumes:
  influxdb-data:
  grafana-data:
Bring it up with docker compose up -d. InfluxDB's own web UI is then at http://<your-host>:8086 — log in with the username and password you set in DOCKER_INFLUXDB_INIT_USERNAME and DOCKER_INFLUXDB_INIT_PASSWORD. Change all three change-me values before you run this on anything exposed to your network.
Either way, note the organisation, bucket, and API token you set — you'll need all three for both the Home Assistant integration and the Grafana data source. If you're migrating an existing InfluxDB 1.x install rather than starting fresh, treat it as a one-way move: back up your current data first, then follow the export/import steps in the InfluxDB v2 add-on's own migration notes (influx_inspect export on the old container, influx write into the new one) — the maintainers flag this process as capable of breaking your install if rushed, so don't skip the backup.
Step 2: Connect Home Assistant to InfluxDB
This is the part that has changed most recently, and it's worth reading before you paste anything into configuration.yaml. Home Assistant is removing the InfluxDB connection settings from YAML. If you add the old-style block with host, token, organization and friends, current versions will import it into a UI config entry and then raise a repair warning telling you to delete those keys:
The InfluxDB YAML configuration is being removed. This stops working in version 2026.9.0.
Home Assistant imports the connection settings into a UI config entry for you, then asks you to delete them from YAML. The filtering options stay where they are. Here's the split:
| Moves to the UI | Stays in configuration.yaml | |
|---|---|---|
| Connection | api_version, host, port, path | include |
| Authentication | username, password, token | exclude |
| Target | database, organization, bucket | tags |
| TLS | ssl, verify_ssl, ssl_ca_cert | measurement_attr |
The connection: set it up in the UI
Go to Settings → Devices & services → Add integration and search for InfluxDB. The flow asks two things. First, Choose InfluxDB version — pick InfluxDB v2.x / v3 (both install paths in Step 1 give you v2). Then the InfluxDB configuration screen asks for:
- URL — the full URL including scheme and port, not just a hostname. On the Docker route that's
http://influxdb:8086, matching the service name in your Compose file; on Home Assistant OS it's the InfluxDB v2 app's internal hostname from its Info tab, on port 8086. The box pre-fillshttps://, so remember to change it tohttp://unless you've put a TLS proxy in front of InfluxDB. Prefer the hostname over an IP address: it survives the container getting a new address. - Verify SSL certificate — leave this unticked for a plain
http://connection on your own network. - Organisation and Bucket — the names you set in Step 1 (
homeandhome_assistantif you used the Compose file above). - API token — the InfluxDB token, which needs write access to that bucket.
- SSL CA certificate — optional, and not needed for a local unencrypted setup.
Submit, and Home Assistant confirms with "Created configuration for home_assistant (http://influxdb:8086)" — named after your bucket, with the URL beside it. The integration then appears under Settings → Devices & services → InfluxDB, and that entry is what holds your credentials from now on.
The filtering: this part stays in YAML
Which entities get streamed is still configured in configuration.yaml, and this half of the block is not going away. Add just this:
influxdb:
  include:
    domains:
      - sensor
      - binary_sensor
      - climate
    entity_globs:
      - light.*
  exclude:
    entities:
      - sensor.date
      - sensor.time
The include/exclude block is optional but strongly recommended — without it, every entity in your system streams to InfluxDB, including diagnostic and configuration entities you almost certainly don't want charted. The integration matches an explicit entity list first, then domains, then glob patterns, so you can be as broad or as precise as you like.
Already have the old YAML block?
You don't need to start over. Home Assistant has already copied your connection settings into a config entry — just delete the connection and authentication keys from configuration.yaml, leave include/exclude in place, and restart. The repair notification clears itself. If your old block referenced a token via !secret influxdb_token, you can drop that line from secrets.yaml too once the UI entry is working.
Save the file and restart Home Assistant. If the connection is working, you'll see state changes for your included entities start appearing in InfluxDB within a minute or two — check the InfluxDB v2 UI's Data Explorer to confirm, or check the Home Assistant log for any influxdb connection errors (a silent log with no errors is actually a good sign — the integration only logs on failure).
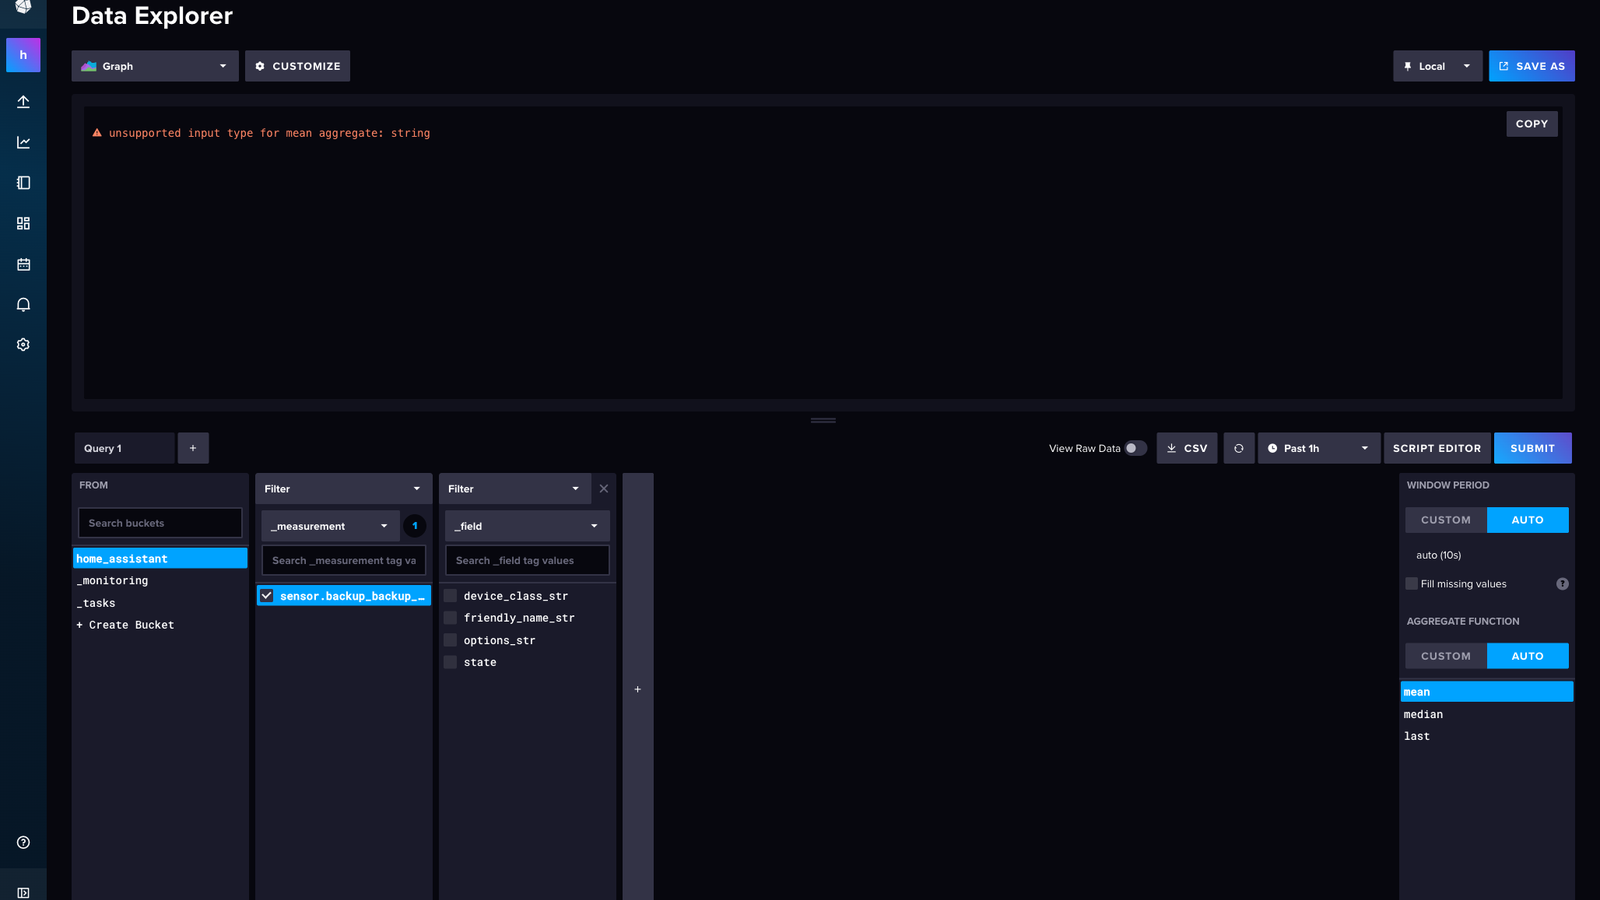
In Data Explorer, select your bucket, pick a measurement, and then — this bit matters — also tick _field → value. Home Assistant writes text fields (friendly_name_str, device_class_str) alongside the numeric one, and if you submit without the field filter, Data Explorer tries to average the strings and fails with unsupported input type for mean aggregate: string. That error means your data is arriving fine; it just needs a narrower query.
value field selected.Step 3: Install Grafana
Unlike InfluxDB, the Grafana app hasn't been deprecated — if you're on Home Assistant OS or Supervised, open the store from Settings → Apps, search for Grafana, and install the Home Assistant Community Add-ons version. Start it, enable Show in sidebar, and open it from the sidebar or directly at port 3000. On Container or Core, use the grafana/grafana service from the Compose file in Step 1 instead — same image, same result.
Either way, log in with the default admin/admin credentials. What happens next depends on which route you took. On the plain Docker image, Grafana immediately presents an Update your password screen and won't let you continue until you set a new one — do that and you're done. On the Home Assistant app build, the default admin password can't be changed directly from the UI, so the recommended approach there is to create a new user with the Admin role from Grafana's user settings and then delete the original default admin account.
Step 4: Connect Grafana to InfluxDB
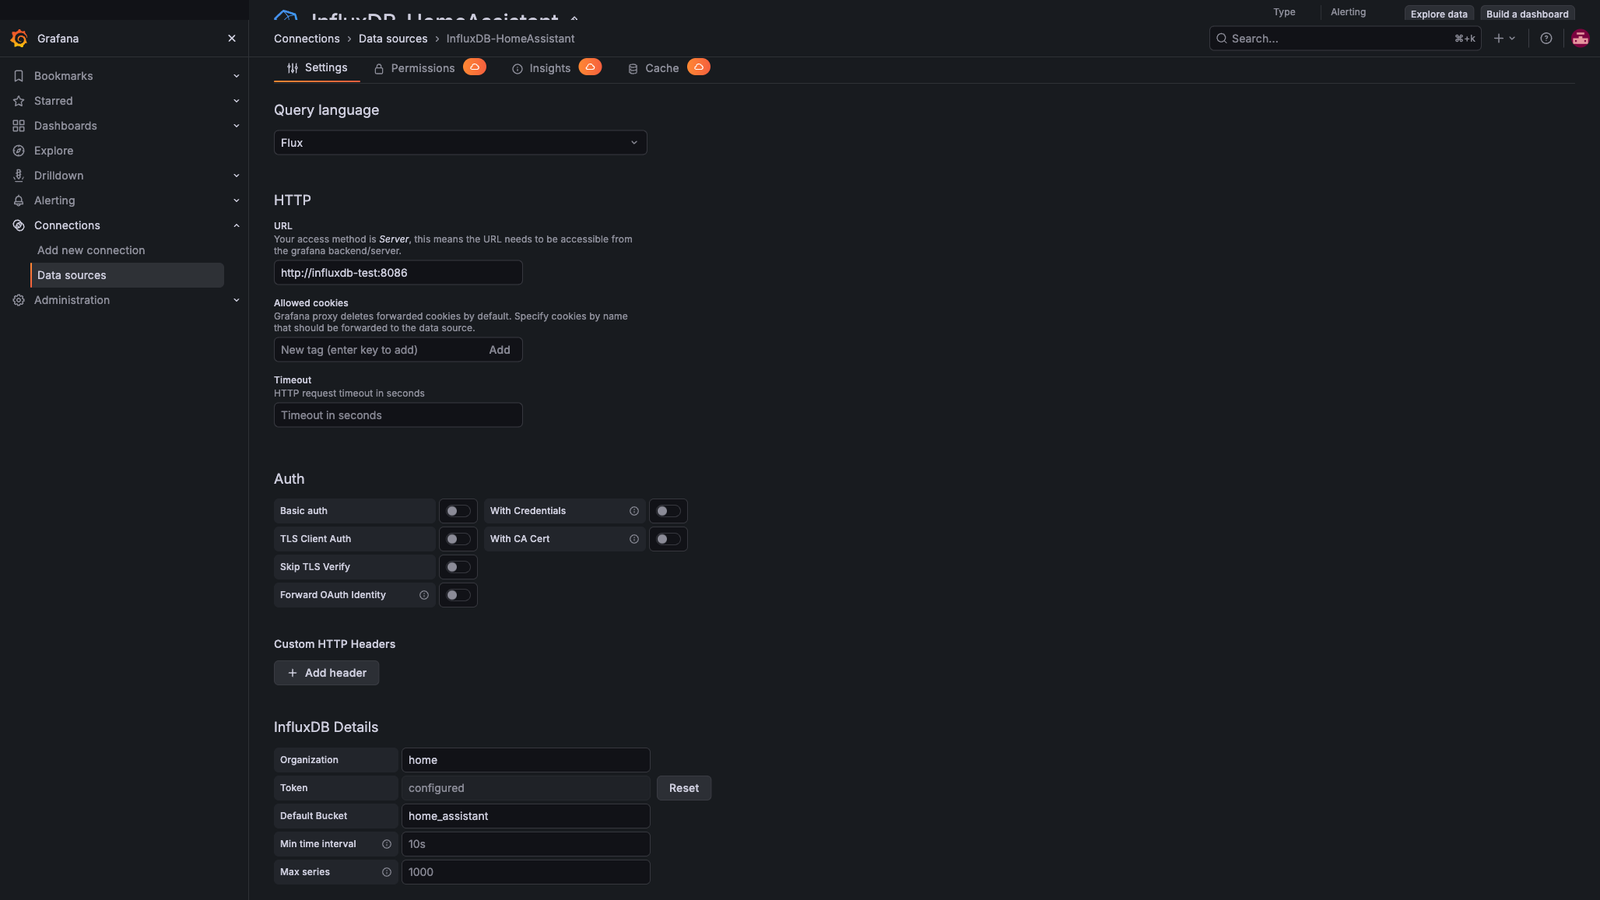
Inside Grafana, go to Connections → Add new connection and search for InfluxDB. Selecting it opens the plugin's overview page rather than a form — click Add new data source in the top right to get to the actual settings screen. There, choose Flux as the query language (Flux is what InfluxDB 2.x uses; InfluxQL and SQL in that same dropdown are for 1.x and 3.x respectively) and fill in:
| Field | What to enter |
|---|---|
| URL | InfluxDB's address and port. Docker route: http://influxdb:8086, matching the service name in your Compose file. Home Assistant OS: the InfluxDB v2 app's internal hostname from its Info tab, on port 8086. |
| Organization | The organisation name from Step 1 — home if you used the Compose file. |
| Token | The InfluxDB API token, with at least read access. |
| Default Bucket | The bucket name — home_assistant if you used the Compose file. |
Click Save & test. A working connection reports back the number of buckets found in your InfluxDB instance — "datasource is working. 3 buckets found", counting InfluxDB's two internal buckets alongside yours. If it fails, the most common causes are a mismatched token, the wrong hostname, or the organisation name not matching exactly. A no such host error in particular means Grafana can't resolve the name you gave it — check it against the service name in your Compose file, and that Grafana and InfluxDB really are on the same Docker network.
Step 5: Build Your First Dashboard Panel
From the Grafana sidebar, go to Dashboards → New → New dashboard. In current Grafana there's no "Add visualization" button — an Add pane opens on the right, and its first item is Panel ("Drag or click to add a panel"). Click that, then Configure visualization on the placeholder that appears. Pick your InfluxDB data source; because the data source is set to Flux, the panel opens straight into the Flux query editor. A basic query to chart a temperature sensor over the last seven days looks like:
from(bucket: "home_assistant")
  |> range(start: -7d)
  |> filter(fn: (r) => r["_measurement"] == "°C")
  |> filter(fn: (r) => r["entity_id"] == "living_room_temperature")
  |> filter(fn: (r) => r["_field"] == "value")
Three things about that query are worth knowing, because guessing any of them wastes an afternoon:
- The measurement is the unit, not the entity. By default the integration names the measurement after the entity's unit of measurement (controlled by
measurement_attr), so a temperature sensor lands under°C. - Entities with no unit are the exception. Those land under a measurement named after the entity ID instead.
entity_idhas no domain prefix. It'sliving_room_temperature, notsensor.living_room_temperature— the domain is stored as a separate tag.
Set the panel type to Time series, give it a title, and Grafana renders a line graph updating live as new data streams in from Home Assistant.
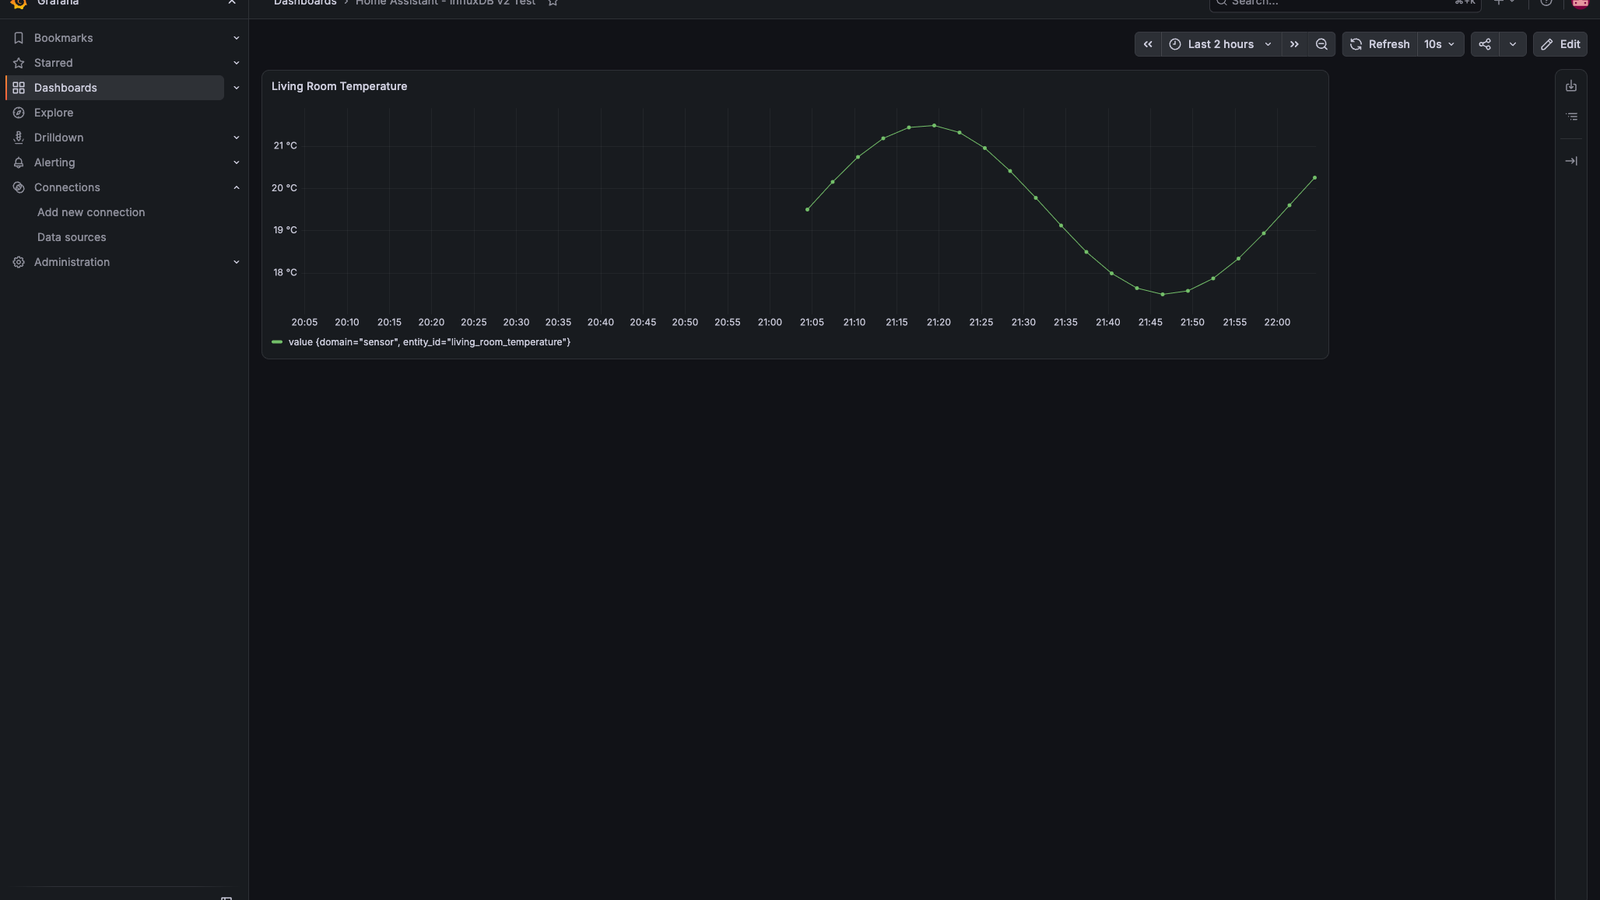
From here, repeat the process for other entities — humidity, energy consumption, or anything else you included in the influxdb: filter — and arrange the panels into a dashboard. Grafana panels can also be pinned as a full dashboard link in Home Assistant's own Lovelace dashboard using an iframe or webpage card, so you don't need to switch apps to check your long-term history.
Common Problems and Fixes
"App InfluxDB has been removed from the repository"
This means you have the old, now-retired InfluxDB 1.x add-on installed. It won't come back — see Step 1 for the two current install paths (the community InfluxDB v2 app, or a standalone Docker container). Dismissing the repair notification doesn't fix anything by itself; you still need to install a replacement and point the InfluxDB integration at it.
"The InfluxDB YAML configuration is being removed"
Different problem, same integration. Your configuration.yaml still contains connection keys that have moved to the UI. Home Assistant has already imported them, so all you need to do is delete api_version, host, port, ssl, token, organization, bucket and any other connection or authentication keys from the influxdb: block, keep include/exclude, and restart. See Step 2.
No data appears in InfluxDB
Check the Home Assistant log for connection errors first — a wrong host or token is the most common cause. Confirm the entity you're checking for isn't accidentally caught by an exclude filter, and that InfluxDB and Home Assistant are both running.
Grafana connects but the panel is empty
This is almost always a mismatched _measurement or entity_id filter in the Flux query — use the InfluxDB v2 UI's Data Explorer to browse your actual measurement and tag names rather than guessing. Remember the measurement is usually the unit (°C, %, W) and the entity_id tag has no domain prefix.
"unsupported input type for mean aggregate: string"
You've selected a measurement without narrowing to a field. Tick _field → value and submit again — Home Assistant writes text fields alongside the numeric one and the default mean aggregate can't average those.
Restarting Home Assistant drops the connection
This is expected — the integration reconnects automatically once Home Assistant finishes starting, and any missed writes during the restart simply aren't recorded (InfluxDB doesn't backfill).
Is It Worth Setting Up?
For most casual users, Home Assistant's default 10-day recorder and the built-in Energy dashboard are enough. InfluxDB and Grafana earn their keep once you want year-over-year comparisons, custom alerting thresholds Grafana can email or Slack you about, or dashboards that combine Home Assistant data with other sources entirely — server metrics, network throughput, or a solar generation feed, for example. It's a bigger commitment than a stock Lovelace dashboard, but for anyone running Home Assistant as a serious home-data project rather than just light switches, it's one of the most useful additions you can make.